Debugging Memory Leaks In Production JavaScript Applications
At the high level of building web applications, low level details of memory management are typically abstracted away from the programmer. While you still need to be aware of the memory needs of your application, using a language like JavaScript means you don’t need to think about allocation and de-allocation of memory. Or do you?
Despite not having to explicitly manage memory due to the Garbage Collector (which automatically marks and cleans up memory that is no longer “live”), memory use is still of some concern and can sometimes manifest itself in the form of a “memory leak”.
What is a memory leak?
A memory leak exists when your program continually allocates memory (a fixed resource) without releasing it. This can lead to a build up of allocated memory meaning your program runs out of it, causing poor performance or worse, failure to run at all.
This is not always the case when an application runs out of memory, you may find that due to recent changes the application simply just requires more memory (in which case you should allocate more memory resources to the program or optimise it to use less). They key thing here is not how much memory the application requires but the growth of the memory allocation over a fixed period of time.
In JavaScript, memory leaks commonly occur within heap allocated memory, where short lived objects are attached to long lived ones and the Garbage Collector cannot safely de-allocate that memory as it is still referenced from the root set (the global object).
A trivial example:
const requests = [];           // long lived object
app.get('/', (req, res) => {
  requests.push(req.id);       // short lived req object
  res.sendStatus(200);
})
Above we can see an example of a memory leak where on each request we are adding a new req.id to the requests array. req and res will go out of scope when the function returns but requests is referenced by the global object and it’s not clear to the garbage collector when this memory can be de-allocated.
How do I know if I have a memory leak?
The above example is only a few lines of code so spotting the issue is quite simple. Production applications are far more substantial and it will require more effort to identity an issue.
For production applications you need to have metrics and monitoring in place in your infrastructure that will tell you the memory usage of your programs. If you are deploying using AWS (e.g. via Docker and the Elastic Container Service), this data will be available in CloudWatch. You can also setup alerts to notify you when a task begins to run out of memory.
So assuming you have some form of application monitoring in place and you’ve been notified of an issue, how do you go about debugging memory leaks?
Step 1:
Try to clearly identify when the memory leak started.
In this example I will be referring to CloudWatch and deployment via ECS but any good monitoring tool will be able to provide you with the same information.
- In AWS, navigate to CloudWatch > Metrics > ECS > Cluster Name, Service Name
- In the search box, type the name of the service you are interested then select the MemoryUtilization metric by ticking the checkbox.
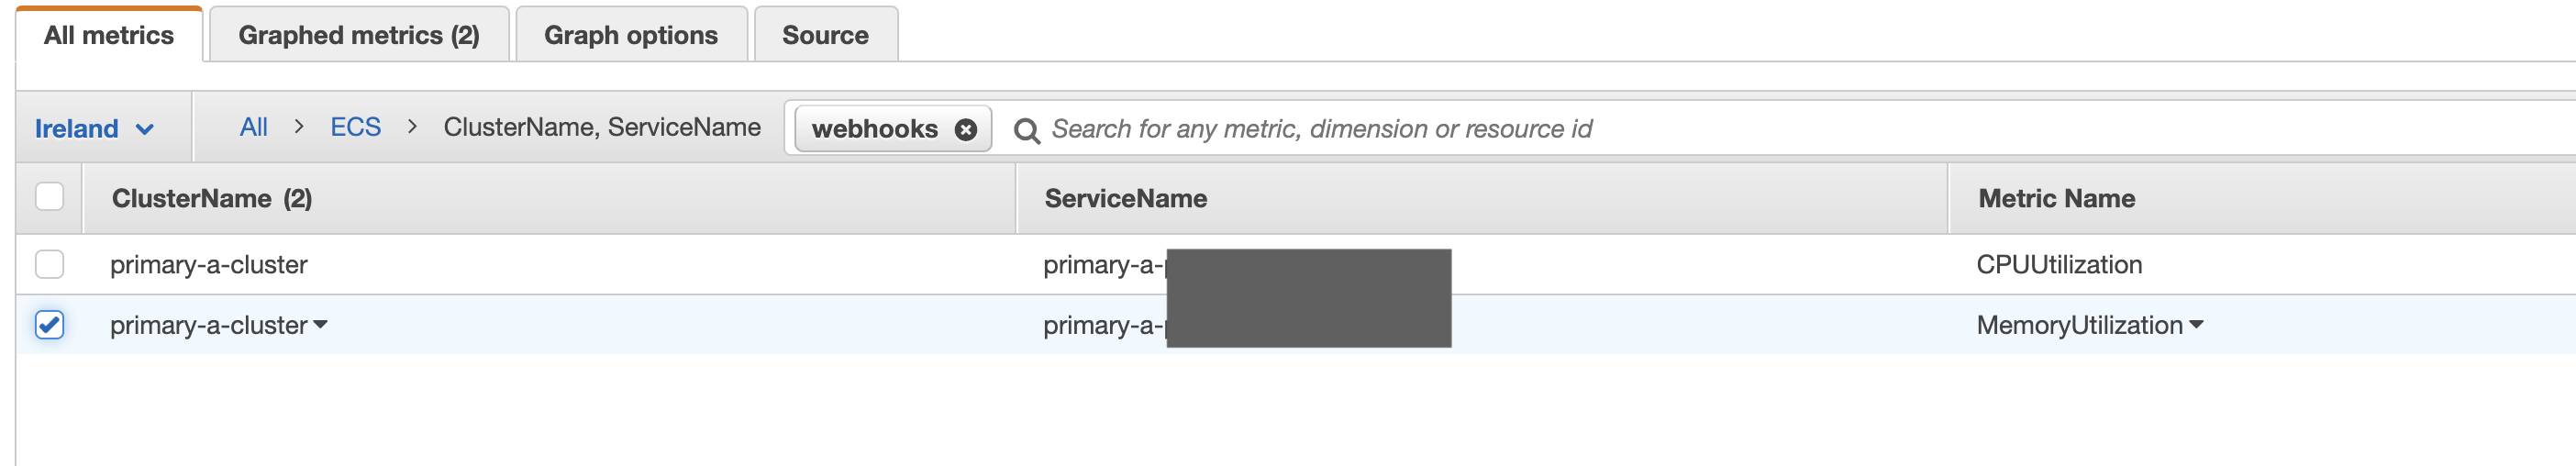
- You will then see a chart of the MemoryUtilization for that service:
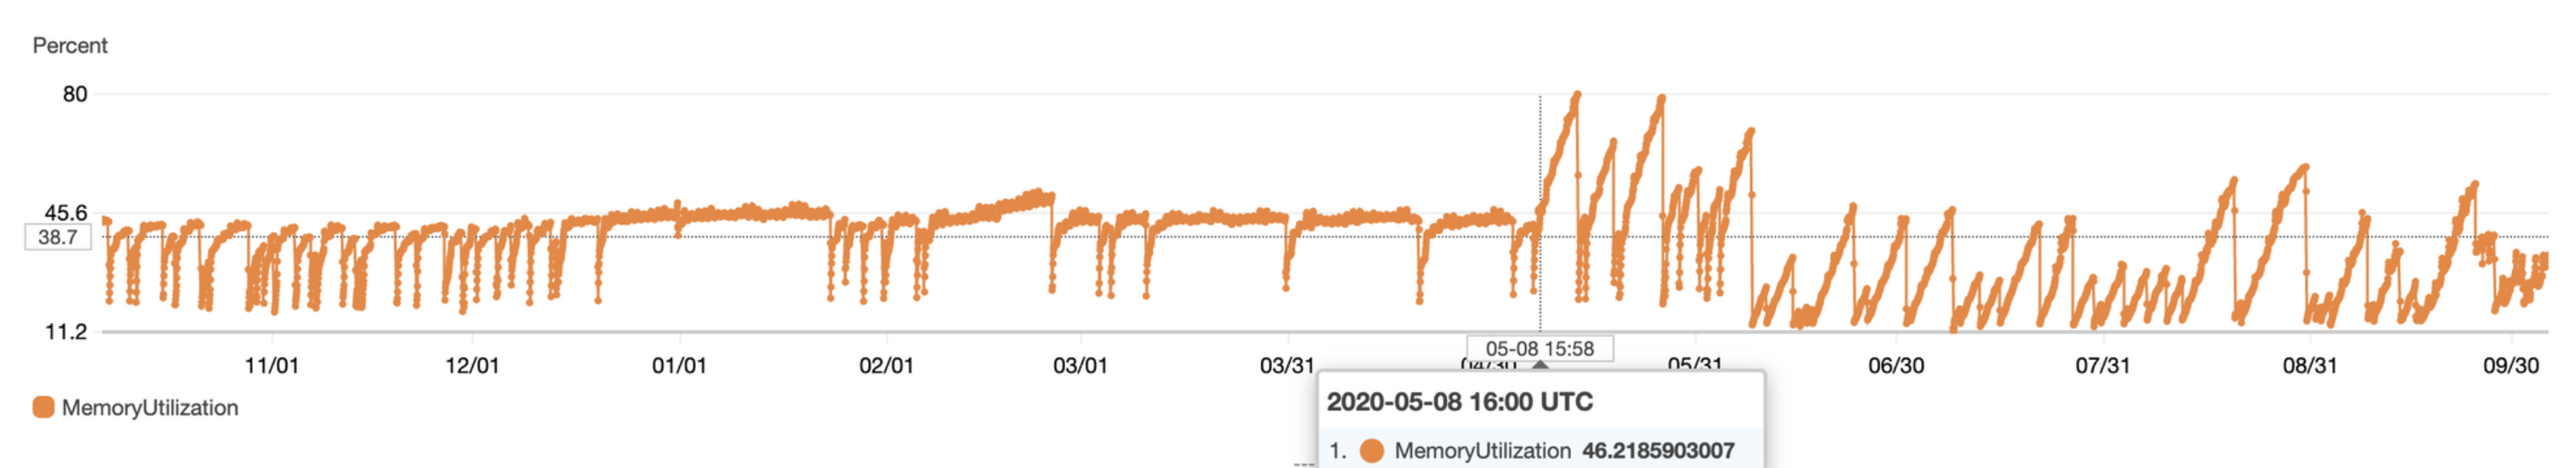
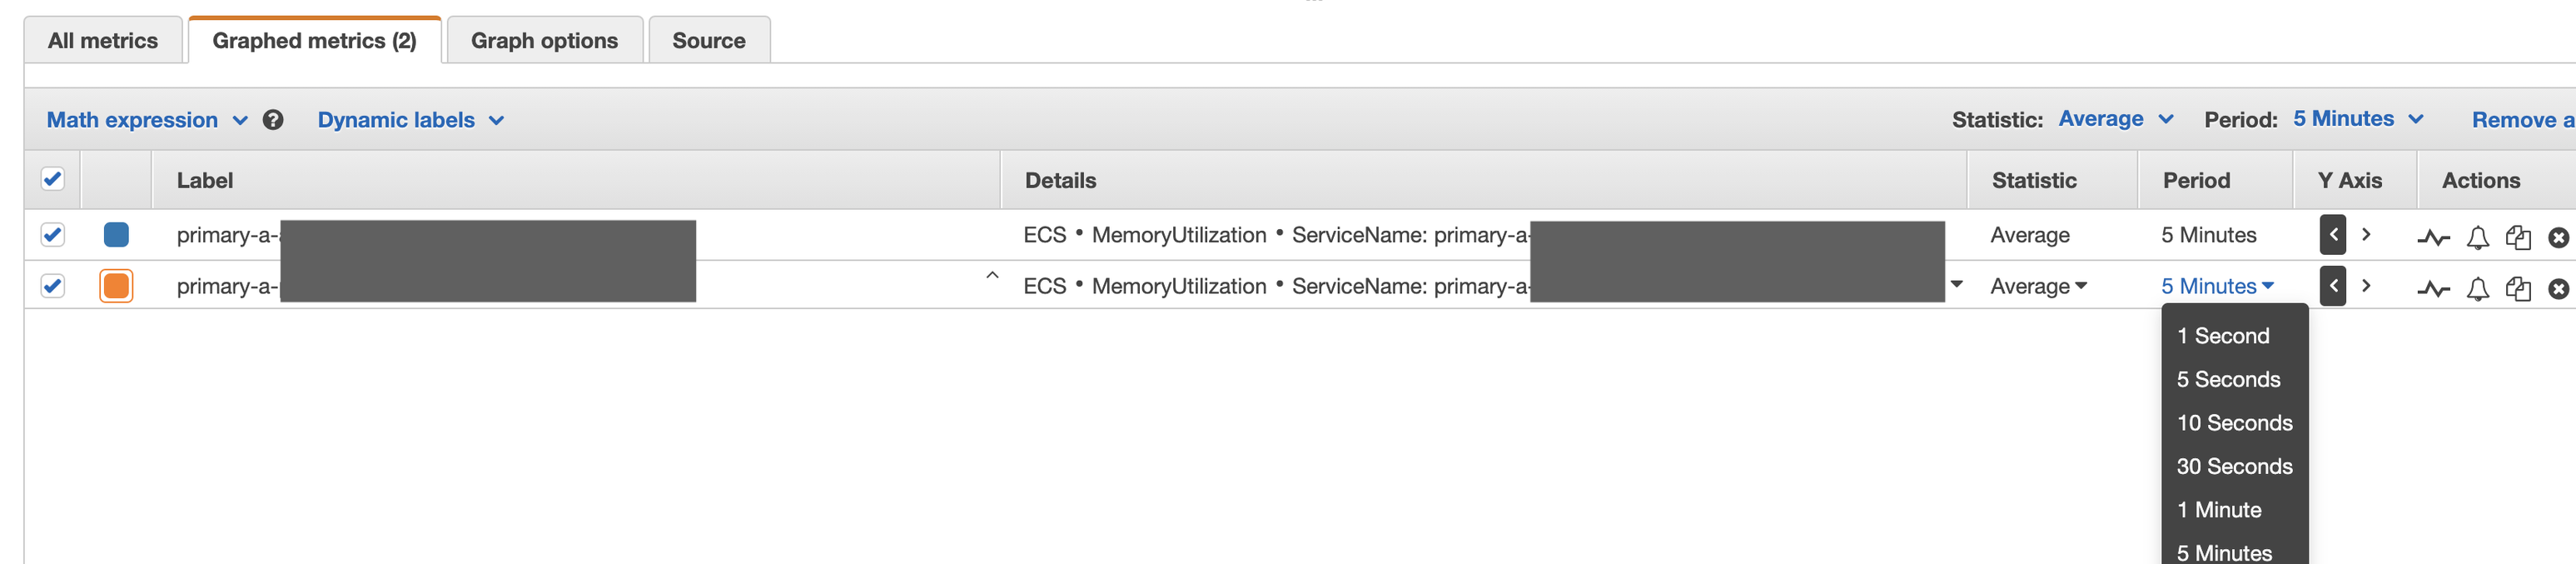
- You can adjust the timeframe in the top right of the screen.
- You may also need to adjust the bucketing Period to a larger time period under Graphed metrics when looking at longer durations.
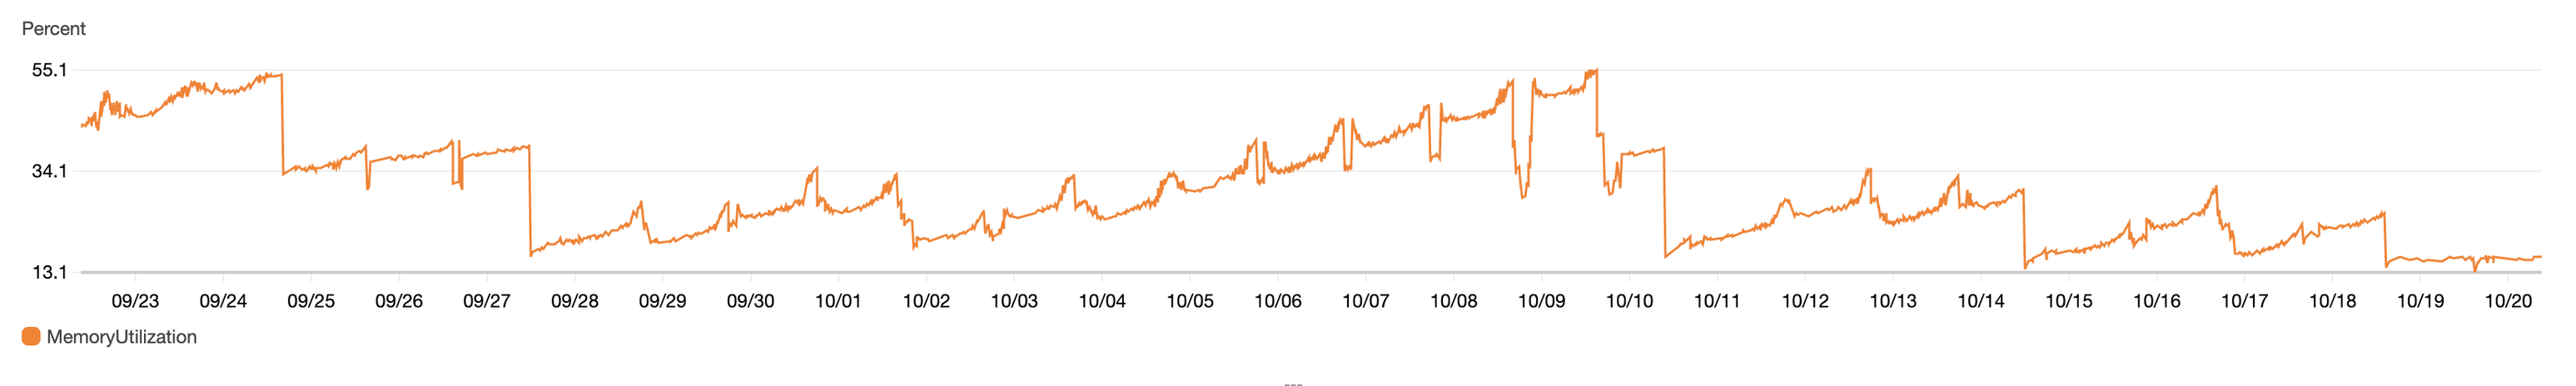
- A memory leak tends to look like the orange line chart above, the utilization grows unbounded over time (after 2020-05-08), with sharp drops when deployments occur causing the heap memory to be reset.
- Check your code integration platform (e.g. CircleCI) to see if you can correlate the master branch deployment times matching up with the utilization drops
- If you can correlate the deployment of a specific PR with the start of the memory leak then you have a great advantage - review the code change and see if there are any likely causes.
- If there’s no clear cause then move to step 2.
Step 2
Local heap analysis
- You will need to analyse what is being allocated memory within your service. In JavaScript, objects are stored on the heap and heapdump is a package that can synchronously write a snapshot of the memory allocation to disk.
-
Integrate this within your service so that you can invoke it when required (an additional endpoint e.g.
/heapdump-{someHashValue}is ideal for this, see code here as an example, you wont need the S3 upload when testing locally.). - Now that you have a way to capture the memory allocation, you will need to test your service to reproduce the memory leak conditions.
- Clinic doctor is a useful for automating this
clinic doctor --autocannon [ -c 60 -d 30 -m GET 'http://localhost:8080/some-url' ] -- node ./lib/index.js
- Take a number of heap snapshots, on starting the service and then at intervals between running automated tests.
-
Once you have the snapshot files, open Chrome Devtools and visit the Memory tab. Under Profiles right click and select Load…, and select each snapshot file.
-
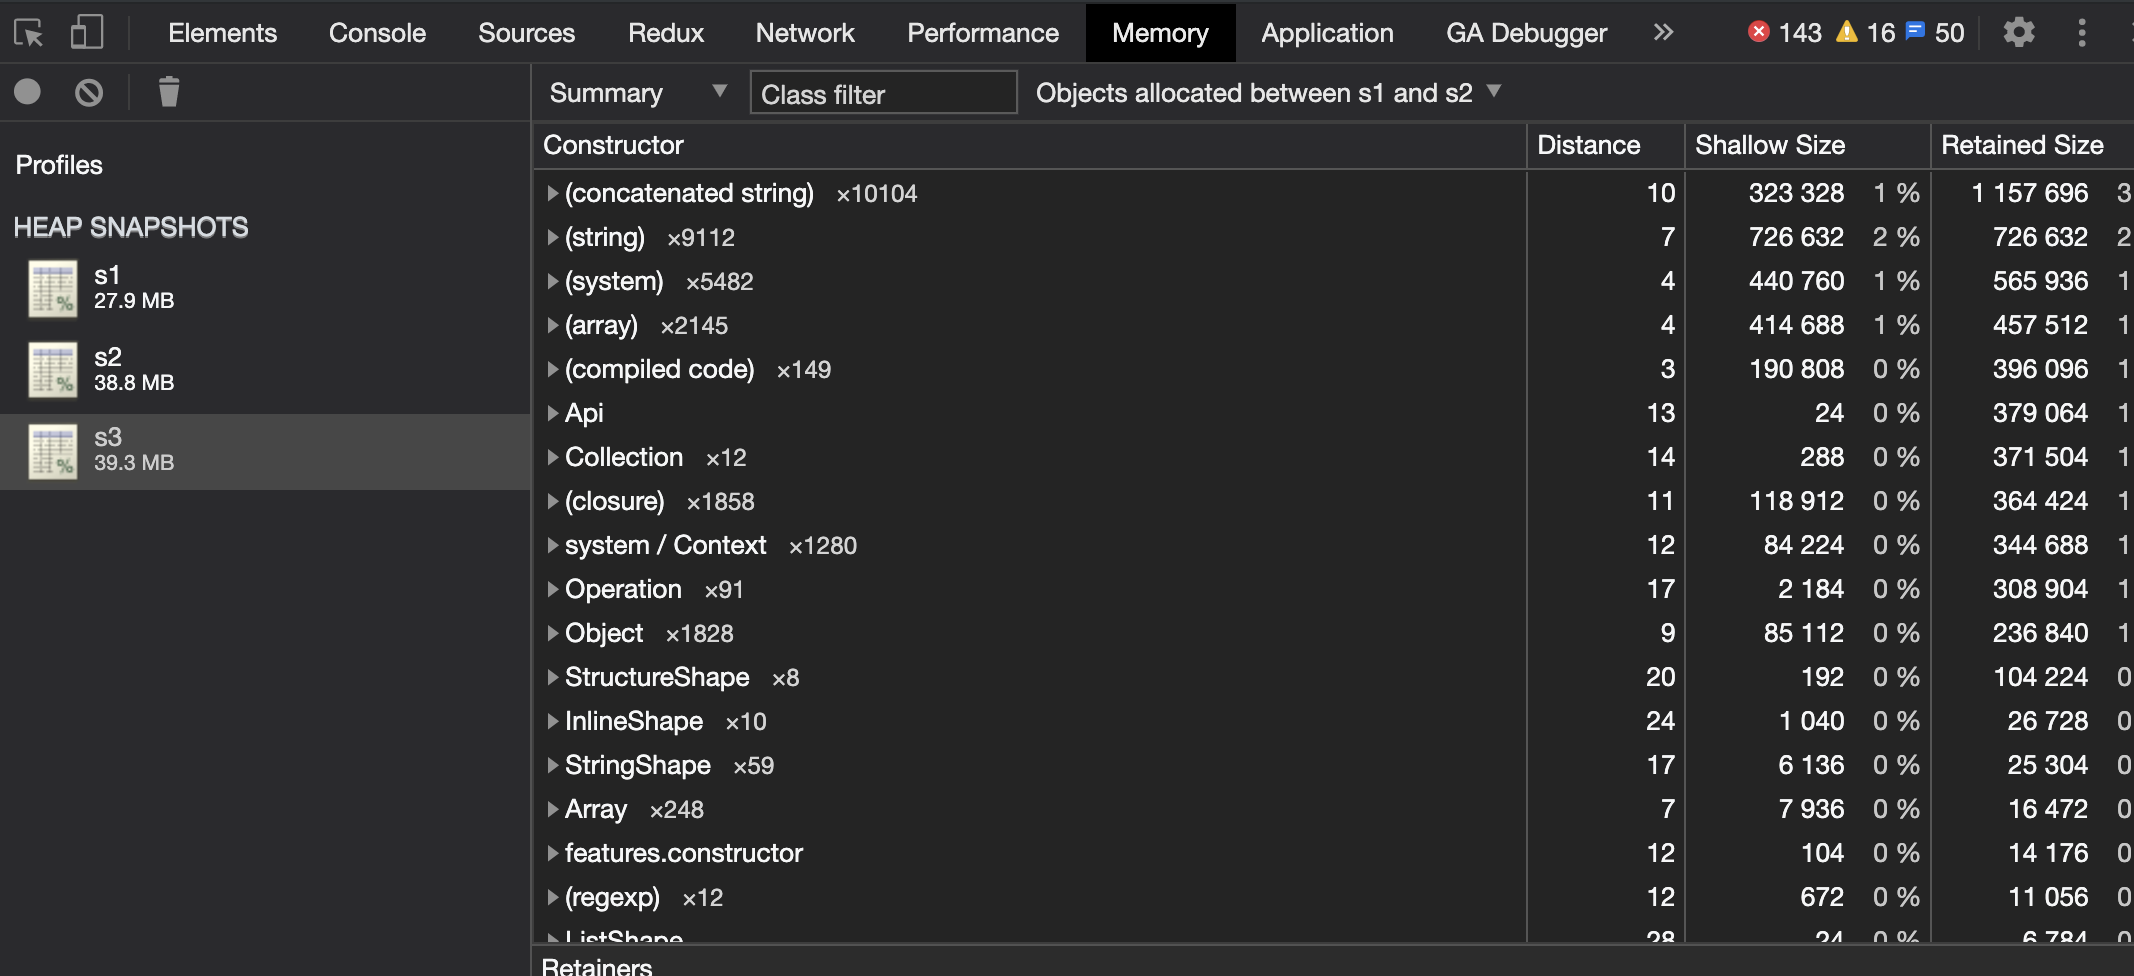
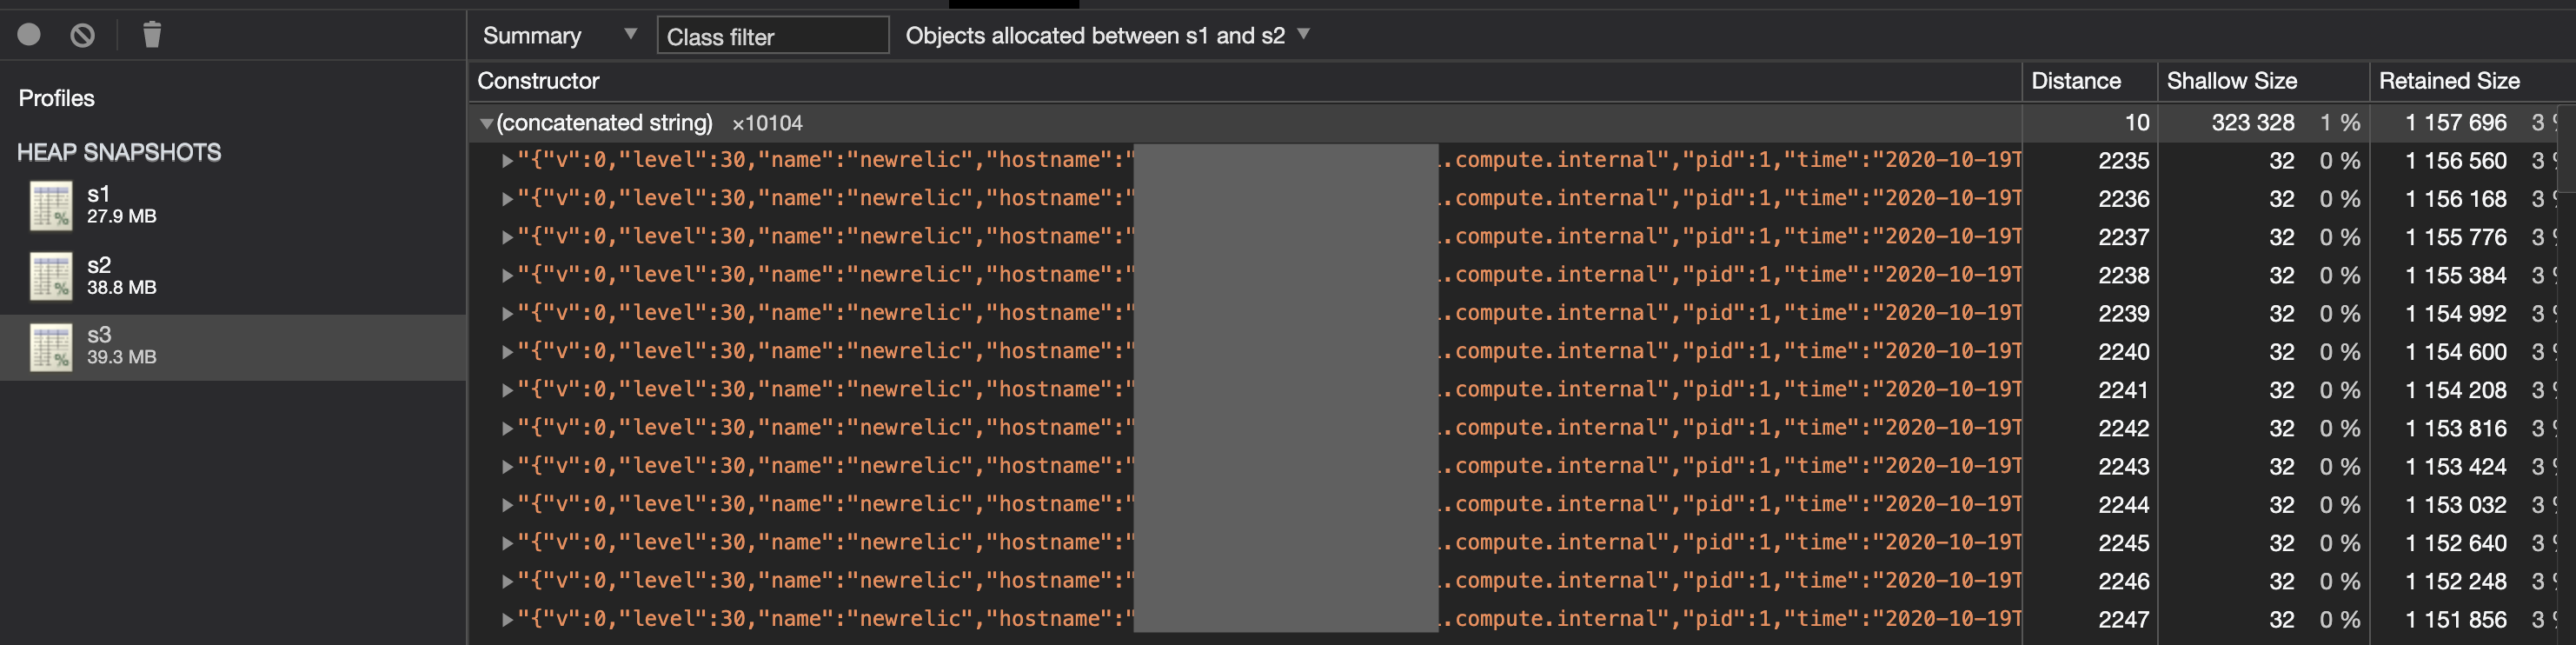
The best indicator is to look at the latest snapshot (e.g. s3), in the Summary view, select All objects and change this to Objects allocated between s1 and s2 (where S1 and S2 represent your first and second snapshot files. Sort by Retained Size.
- This shows you what objects were allocated between the first and second snapshot, yet still remain in memory by the time you have taken the third snapshot.
-
There may be legitimate reasons for objects being retained but this is where you can begin your investigation and identify clues / potential causes for the memory leak.
-
Unfortunately it is a bit of a dark art and requires expanding and investigating the objects, identifying where those objects may be created in code and carrying out different tests locally for different code paths. In some cases where particular Javascript class names can identified from the Summary these are easier to link back to the code itself.
-
It is very difficult to reproduce exact production conditions locally and for all code paths to be hit in the same way, with the same parameters - therefore you will likely need to move to step 3.
Step 3
Production heap analysis
- As discussed earlier, you can add a
/heapdump-{someHashValue}endpoint to your production service and deploy it - see the example here. - This will also upload the snapshot from the docker container to S3 for you to download and perform the same analysis as above in Chrome DevTools. Ensure that you include the hostname link to identify the actual task that has generated the snapshot.
- Be sure to protect the endpoint using authentication and you’ll want at least 2 ECS tasks running for the service so that any service disruption is limited to one instance. The tasks will also need <50% memory utilization to generate the snapshot so you may need to increase the memory allocation.
- The benefit of production snapshots are that the memory leak is actually present in the service - you don’t need to worry about generating those conditions yourself locally.
- In recent memory leaks that I debugged on production services, it was only possible to identify the cause of the leak from production snapshots.
- When analysing the large number of (concatenated string) objects being retained hours after initial allocation, some googling linked it with logs generated from the new relic monitoring agent we had installed on the service. It turned out we were using an old version of the library, upgrading it may have fixed the issue but since we didn’t actually need these logs, I disabled the agent logging via it’s configuration file.
strings held in memory long after allocation
- Once you have deployed any fixes, be sure to monitor the AWS MemoryUtilization for the container (or whatever monitoring tool you are using) and you should hopefully see the line chart begin to stabilise - e.g. from 10/19 below both services were fixed:
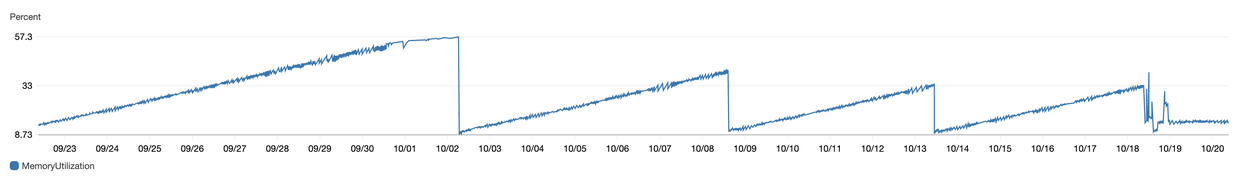
- Note that spikes in the first chart occurred when taking heap snapshots so you may also see those.
- Don’t forget to remove or disable your
/heapdump-{someHashValue}endpoint.
Useful References
Memory leaks are something I have encountered at various points in the past but these posts really helped refresh my understanding and ultimately resolve some recent production issues!
- Memory management: Mozilla
- Understanding memory leaks in node
- How does Javascript work
- How GC works in v8